Web UI
Monitor and manage workflows through Dagu's built-in web interface.
Overview
Dagu includes a modern, responsive web UI that provides:
- Real-time DAG execution monitoring
- Visual DAG representation
- Log viewing and search
- DAG execution history
- DAG (YAML) editor with syntax highlighting and auto-completion
- Interactive DAG management (start, stop, retry, etc.)
Configuration
For Web UI configuration options, see Configuration Reference.
Accessing the UI
# Start Dagu with web UI
dagu start-all

# Open in browser
# http://localhost:8080Custom host/port:
dagu start-all --host 0.0.0.0 --port 9000Dashboard
The main dashboard shows:

Recent Executions
- Timeline of recent workflow runs
- Quick status indicators
- Click to view details
Filters
- Filter by date range
- Filter by status (success, failed, running)
- Search by workflow name
DAG Definitions
The DAGs page shows all DAGs and their real-time status. This gives you an immediate overview of your workflows.
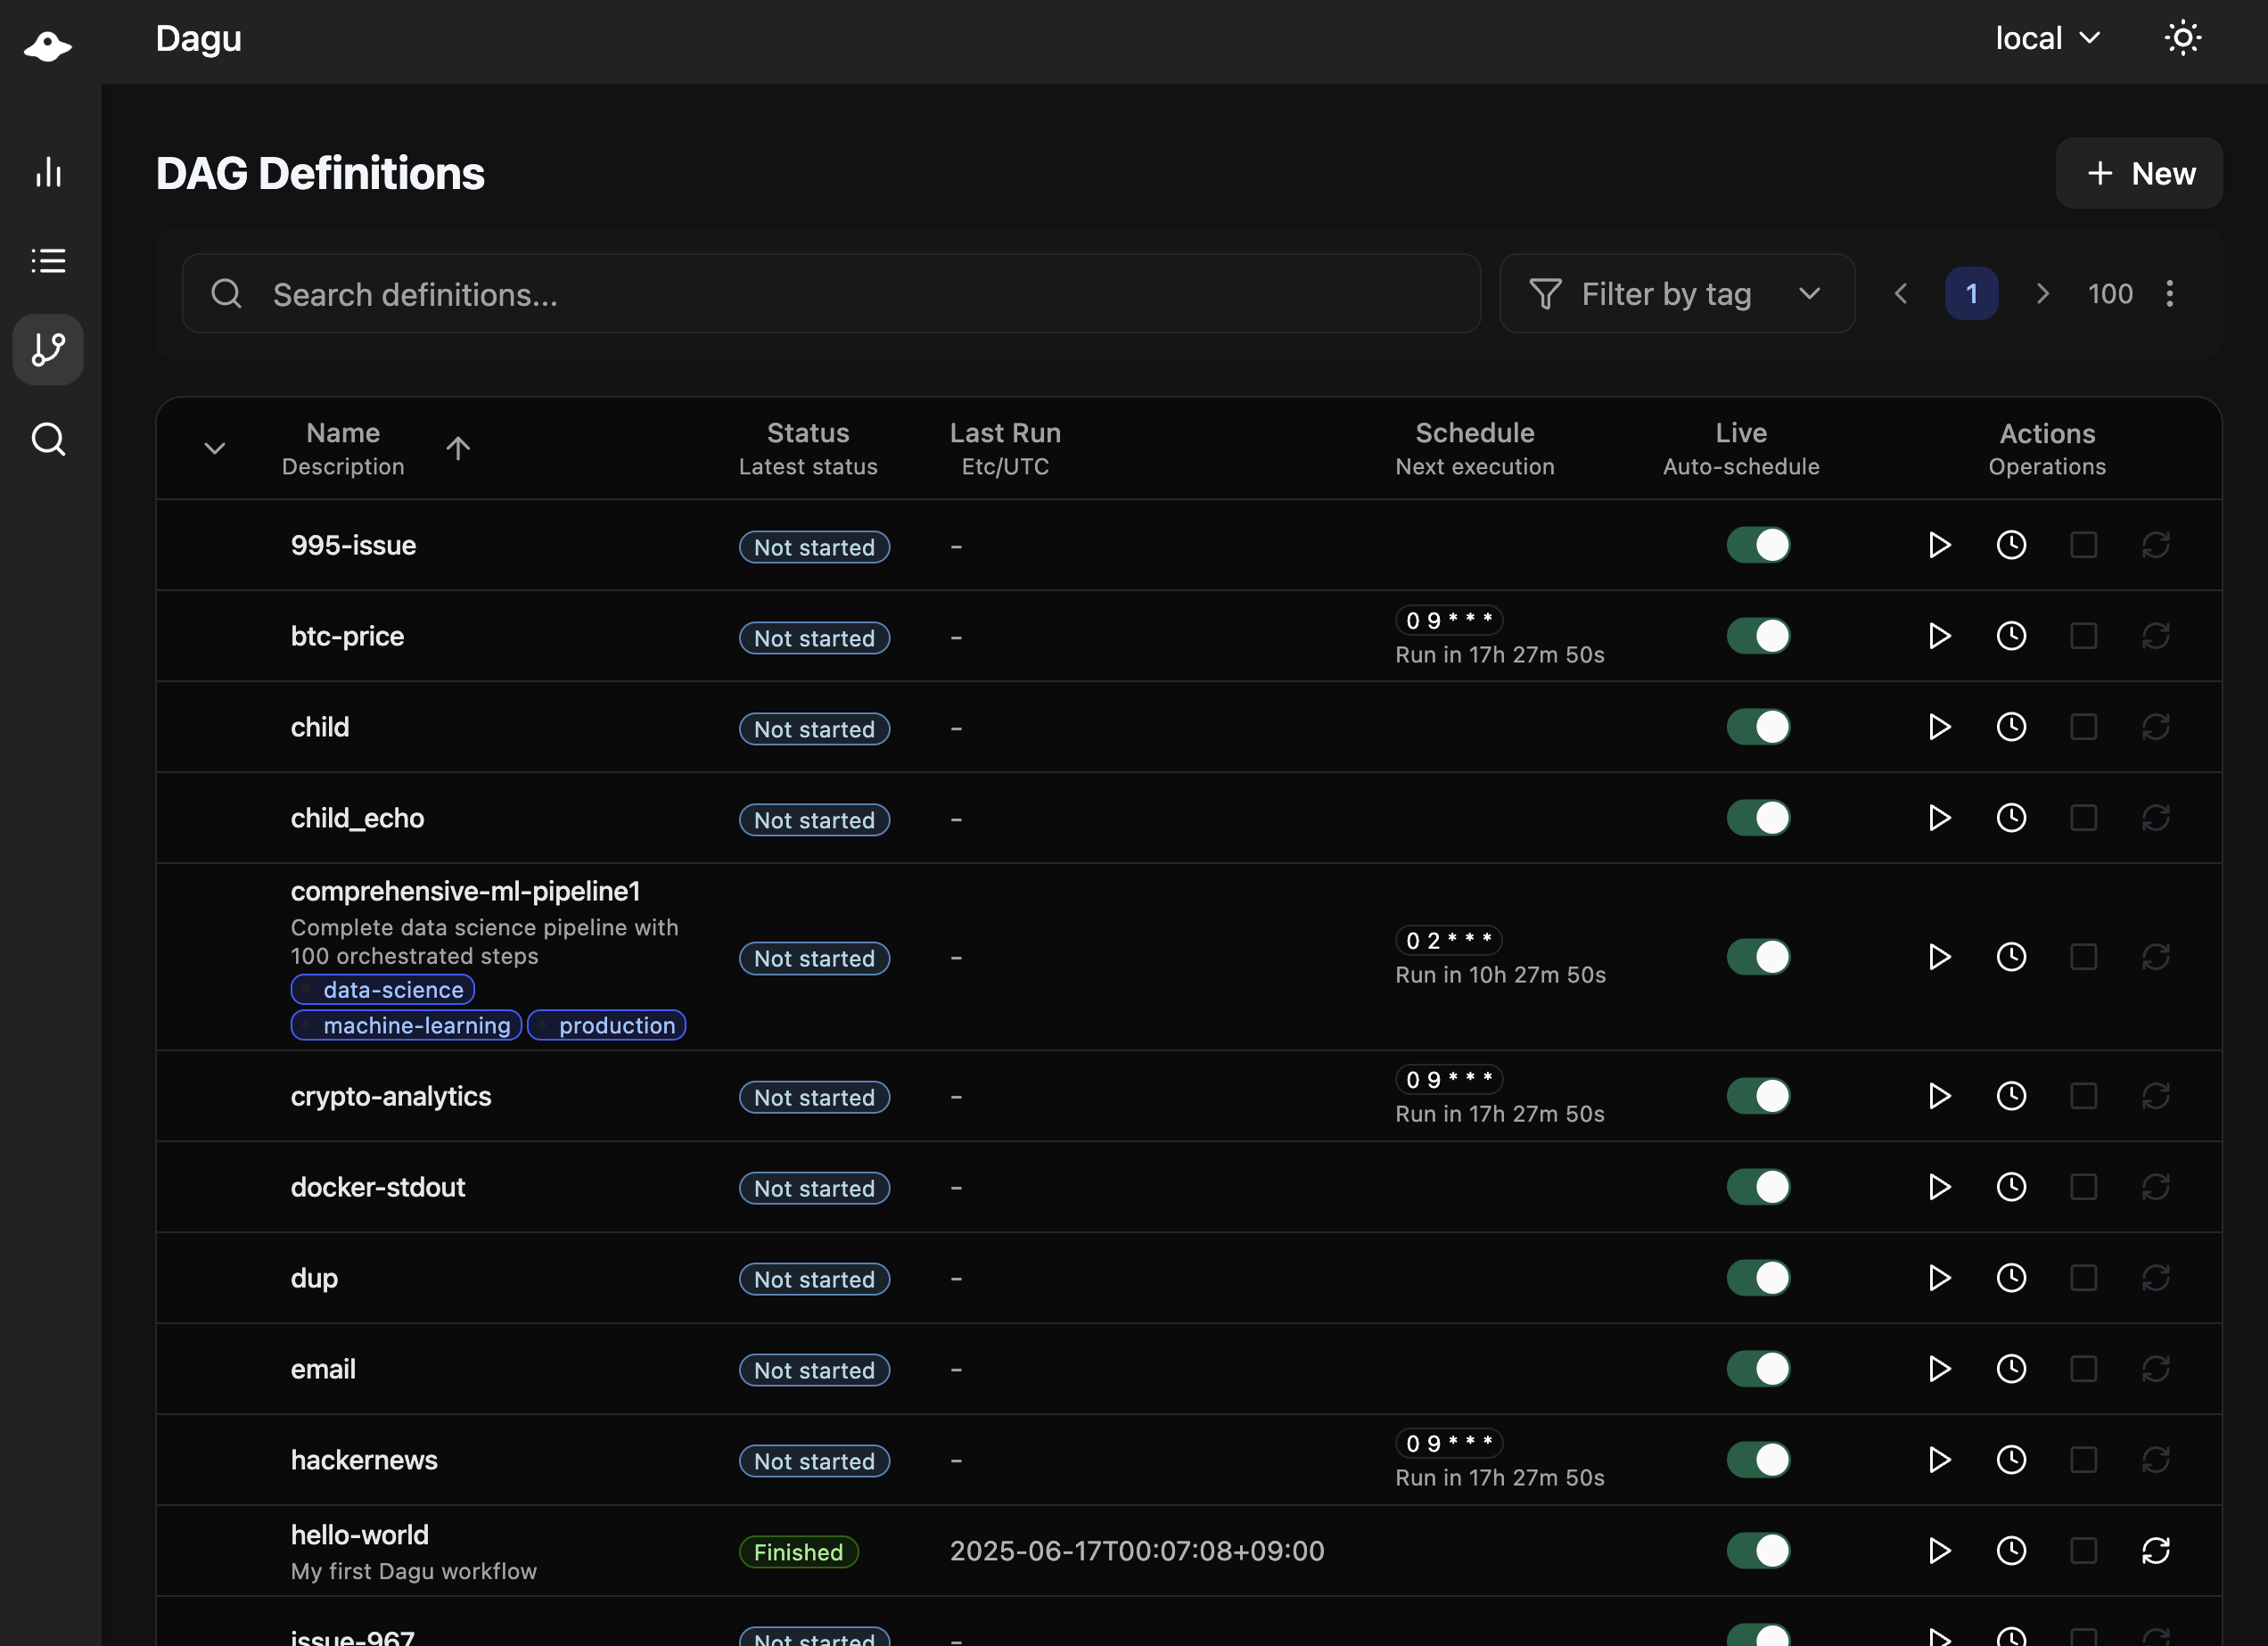
DAG List Sorting
The DAG list can be sorted by:
- Name: Alphabetical order
- Status: Current execution status
- Last Run: Most recent execution time
- Schedule: Cron schedule
- Suspended: Suspension state
Configure default sorting in config.yaml:
ui:
  dags:
    sortField: "lastRun"  # Default sort field
sortOrder: "desc" # Default sort order (asc/desc)Or via environment variables:
export DAGU_UI_DAGS_SORT_FIELD=lastRun
export DAGU_UI_DAGS_SORT_ORDER=descBackend Sorting
Only the name field is sorted server-side. Other fields (status, lastRun, schedule, suspended) are sorted client-side for performance.
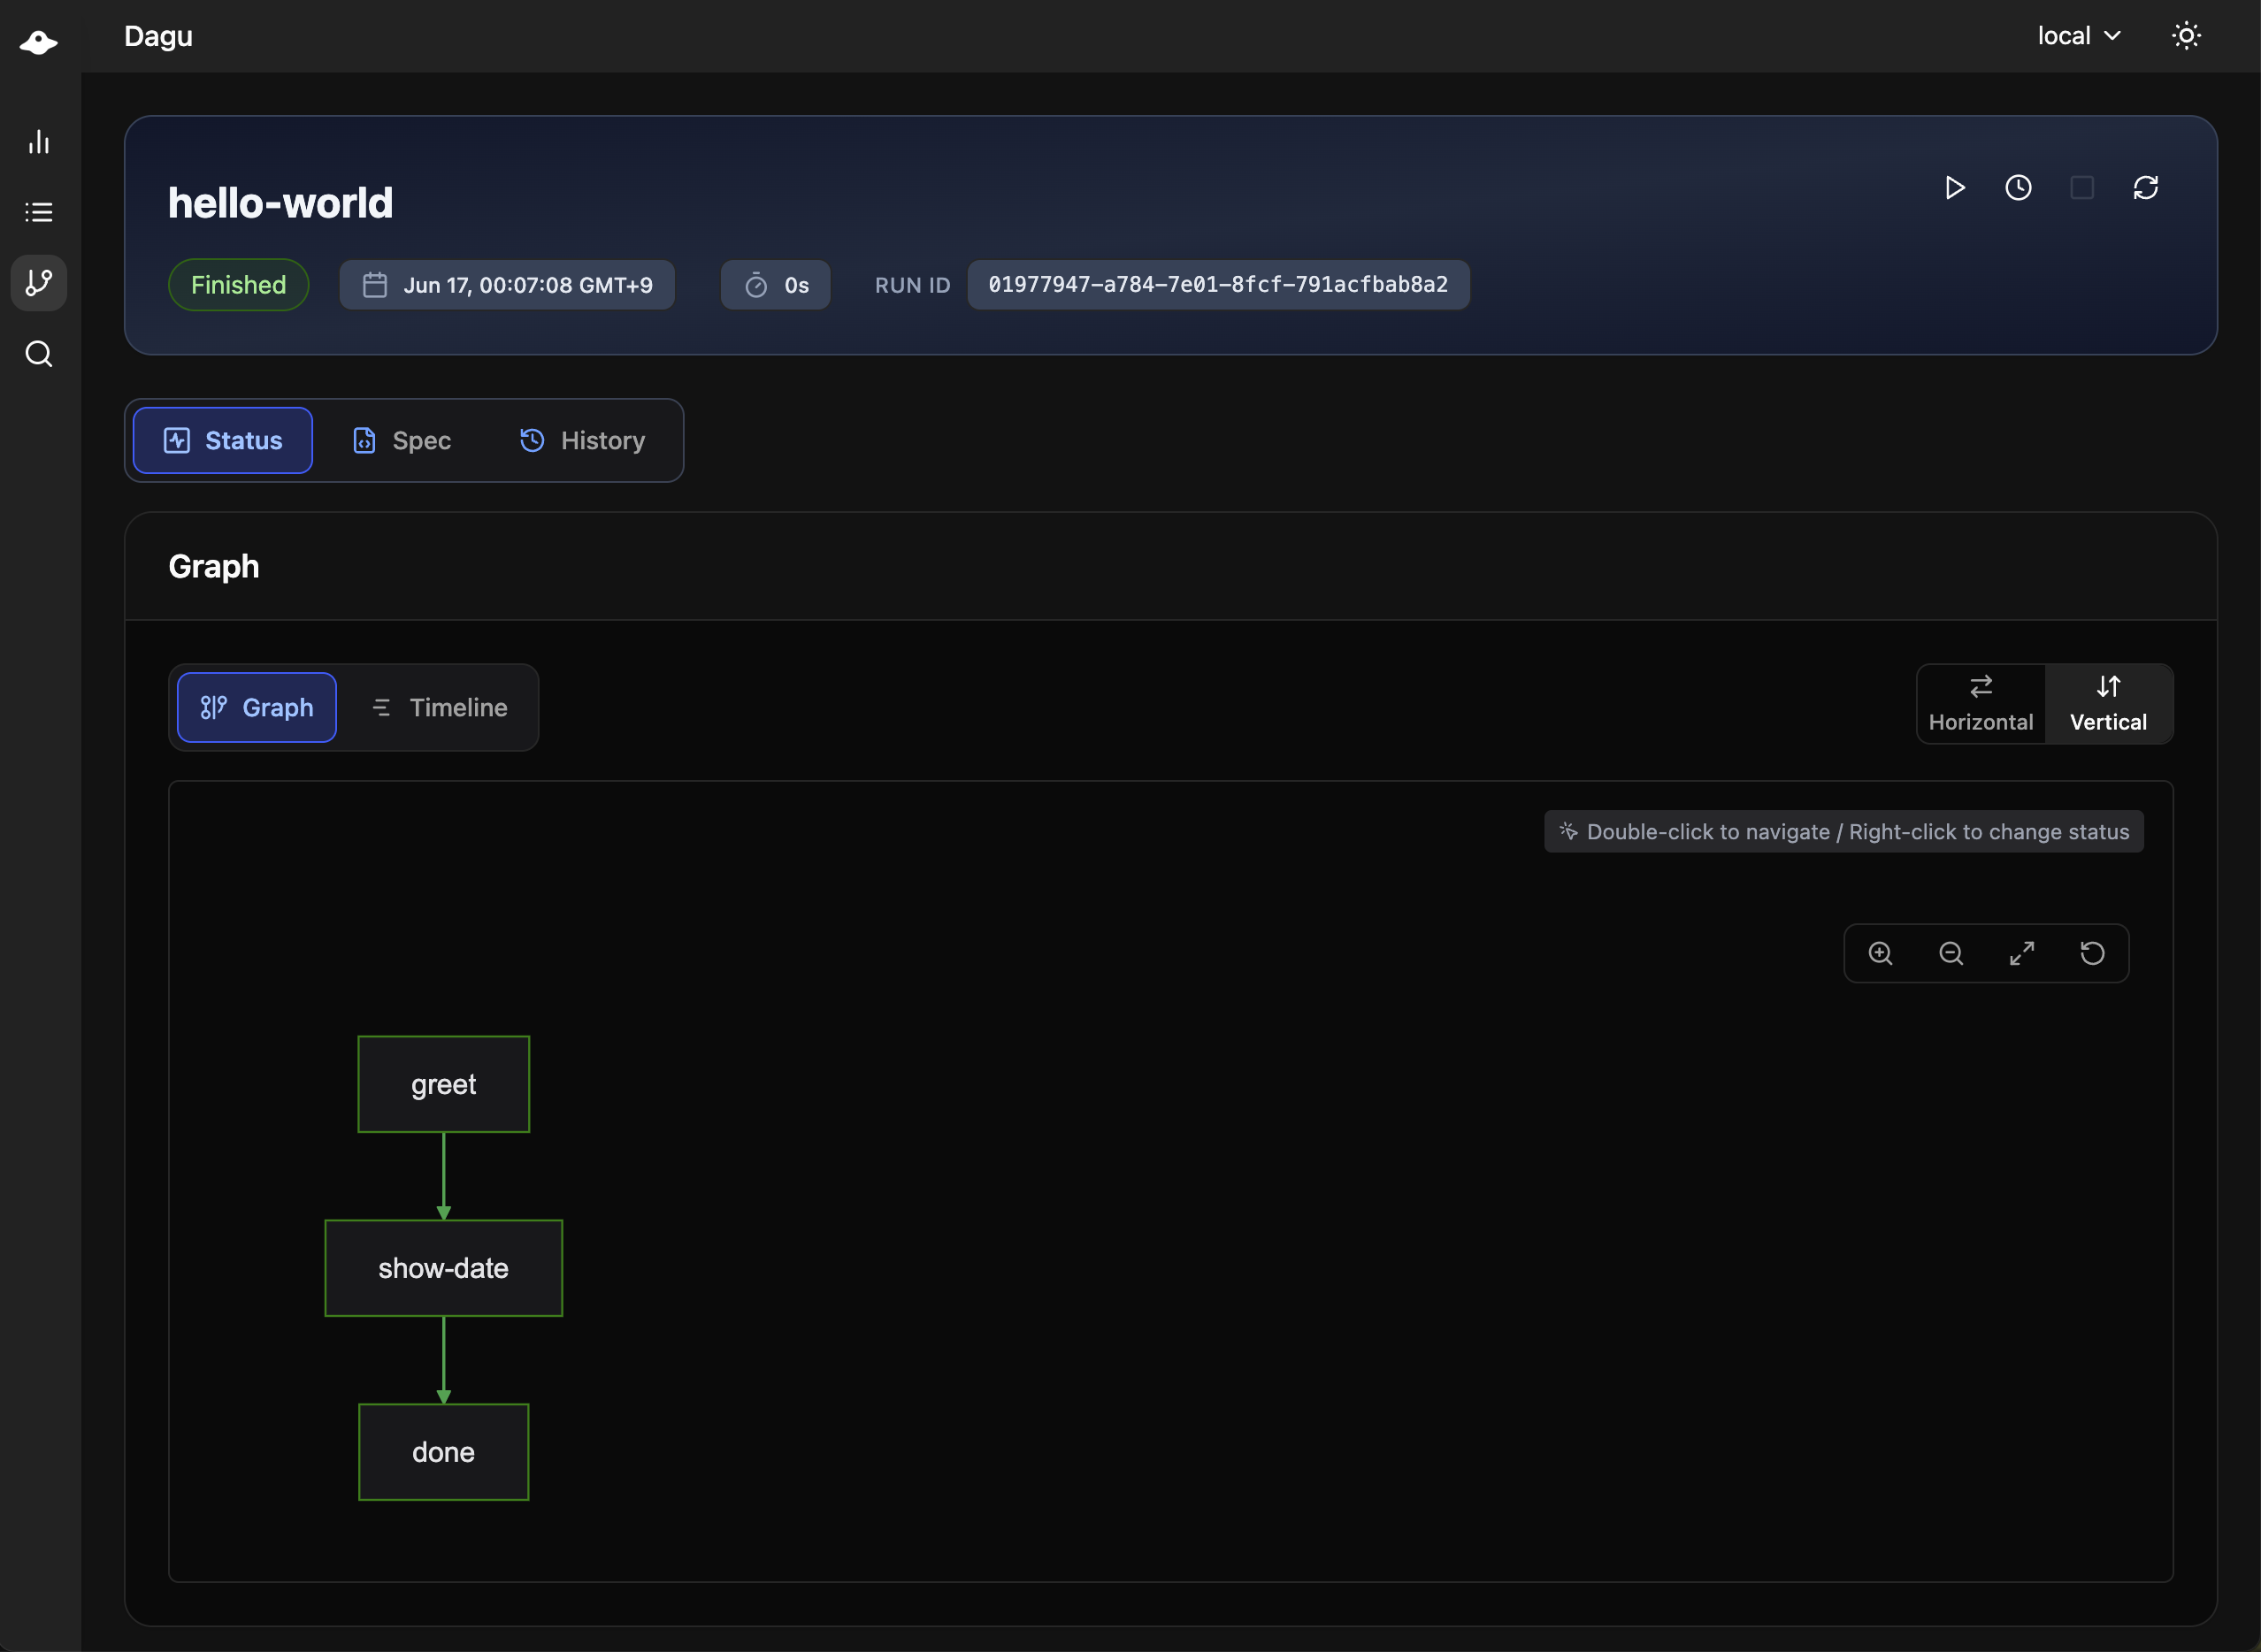
DAG Details
Click any DAG to see detailed information including real-time status, logs, and DAG configurations. You can edit DAG configurations directly in the browser.
Controls
- Start: Run the workflow
- Stop: Cancel running execution
- Retry: Retry failed execution
- Edit: Modify workflow (if permitted)
Information Tabs
- Graph: Visual representation
- Drill-down: Navigate to sub DAG executions by double-clicking steps
- Update Status: Change step status manually by right-clicking steps
- Config: YAML definition
- History: Past executions
- Log: Current execution logs
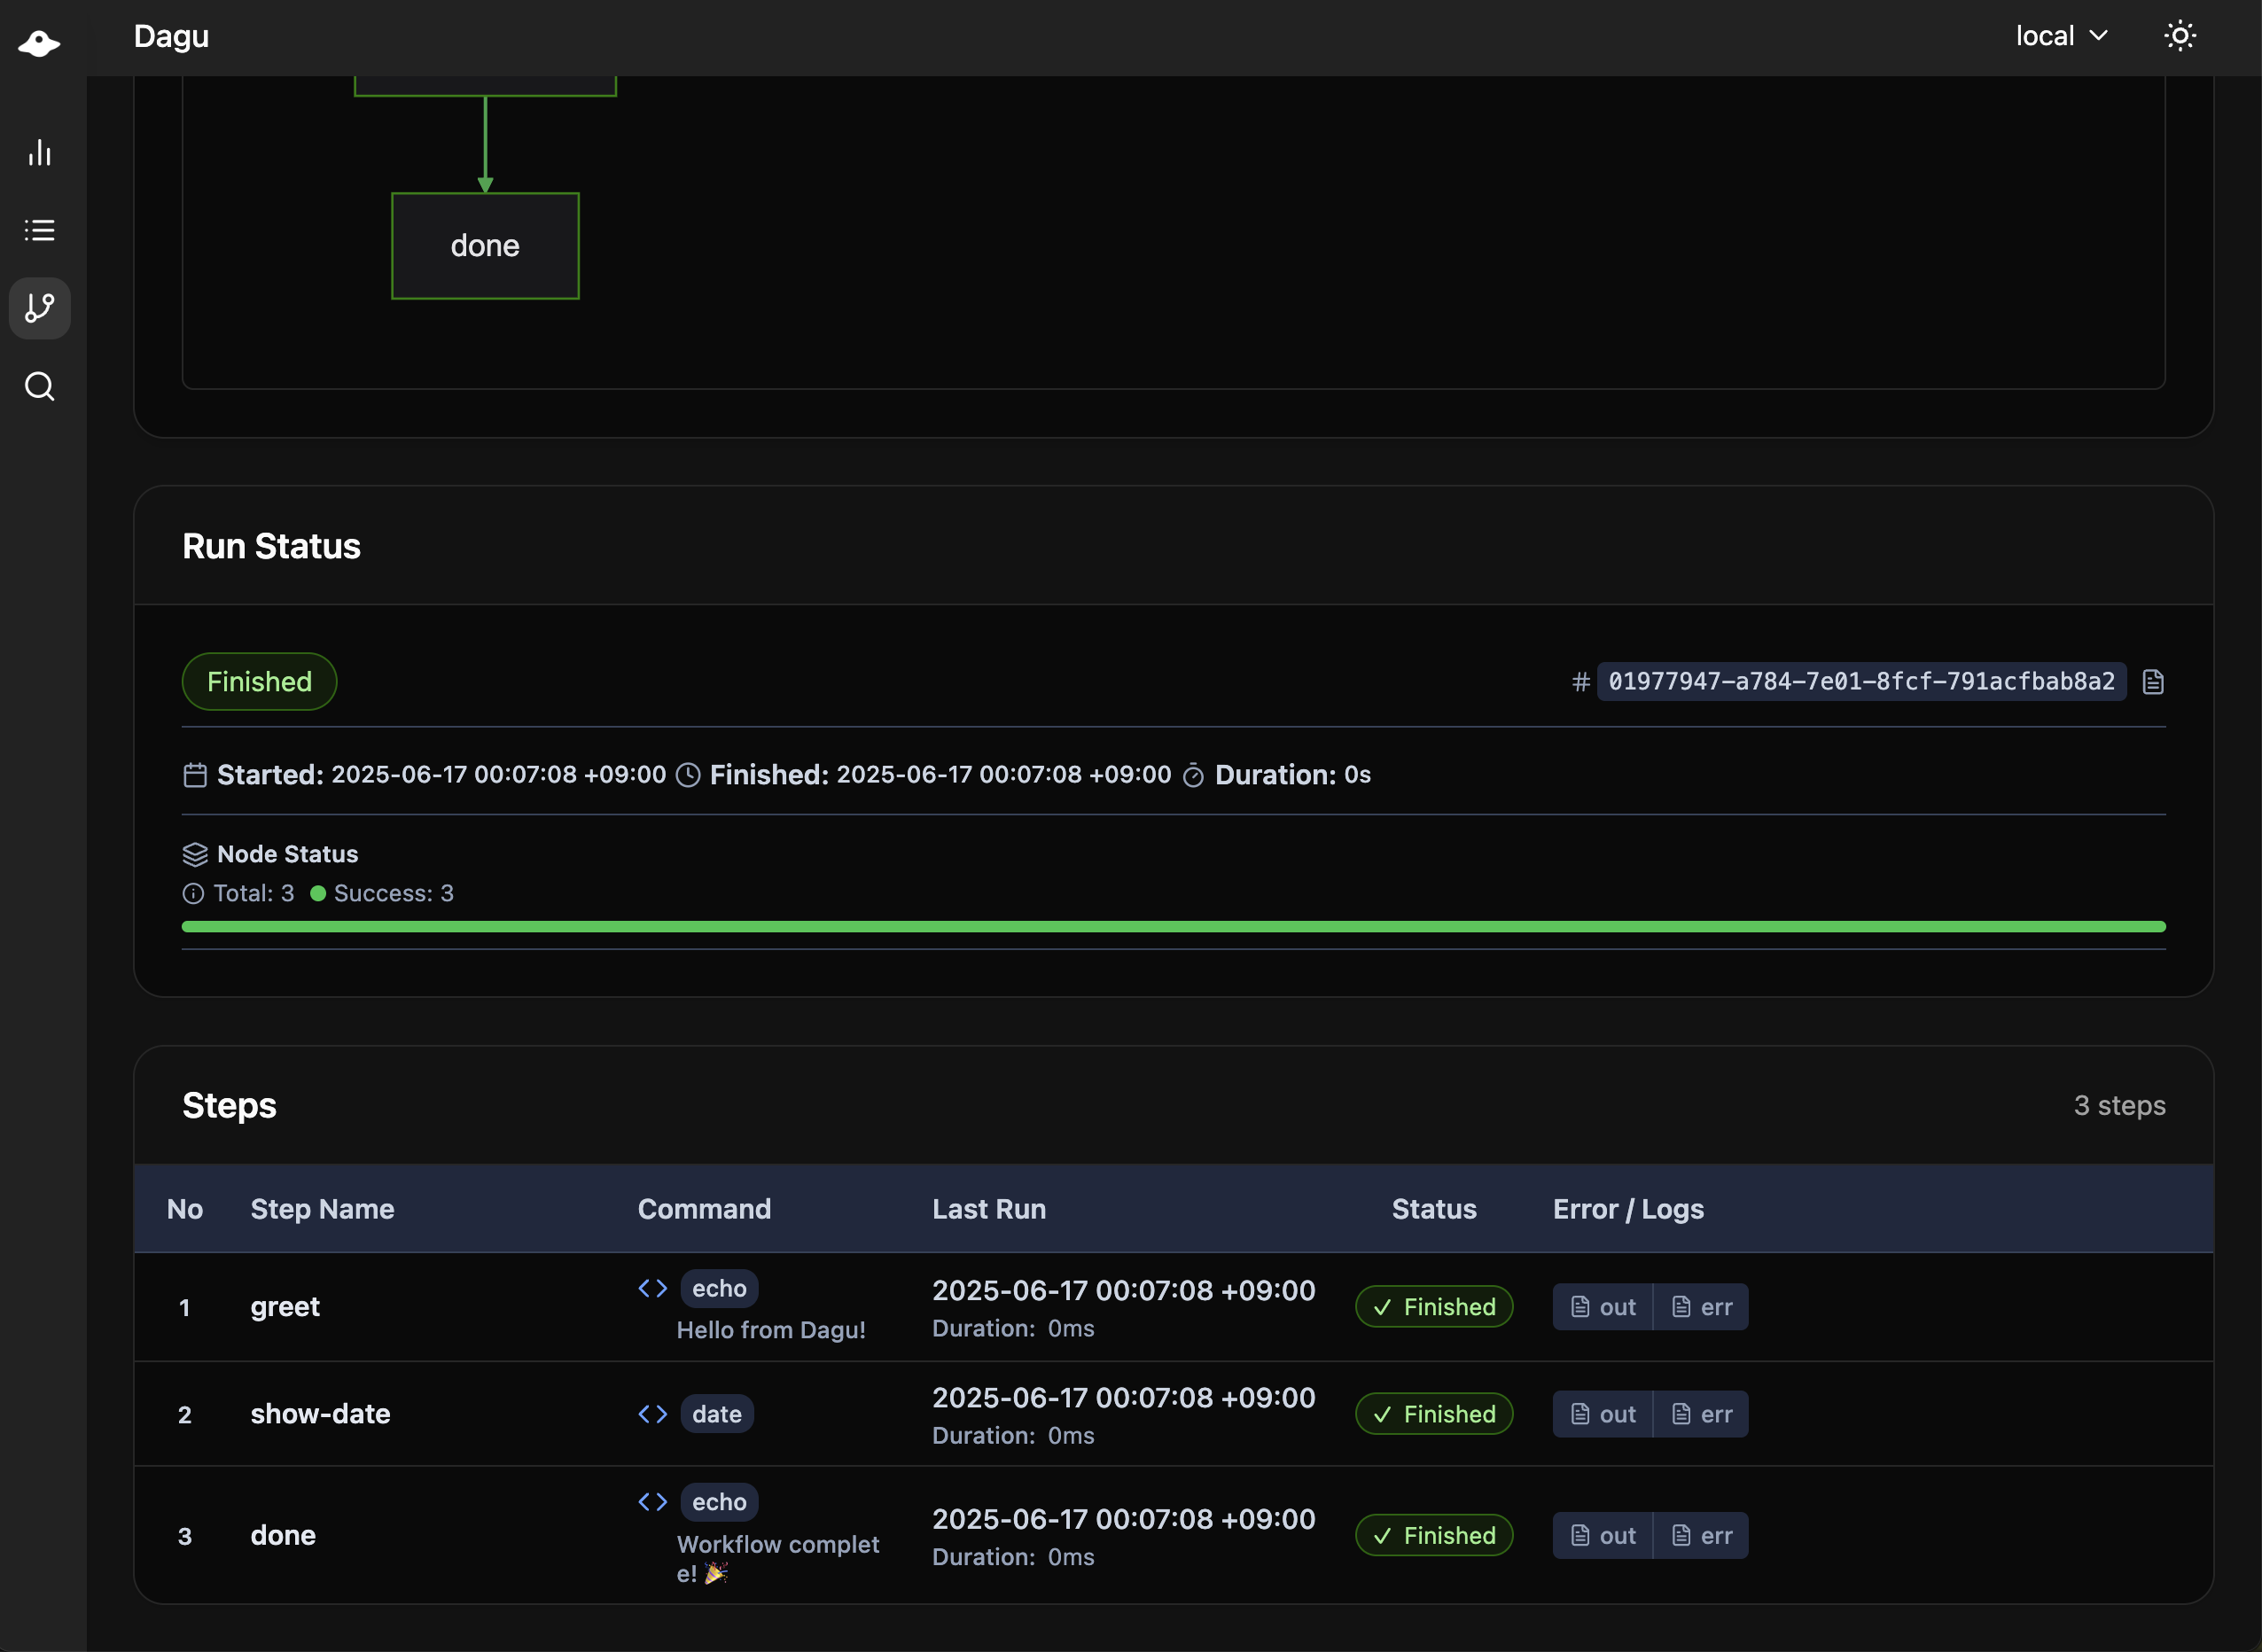
Execution Details
The execution details page provides in-depth information about a specific workflow run, including real-time updates and logs.
Real-time Updates
- Live status changes
- Streaming logs
- Progress indicators
Log Viewer
- Combined workflow log
- Per-step stdout/stderr
- Search within logs
- Download logs
Step Information
- Start/end times
- Duration
- Exit code
- Output variables
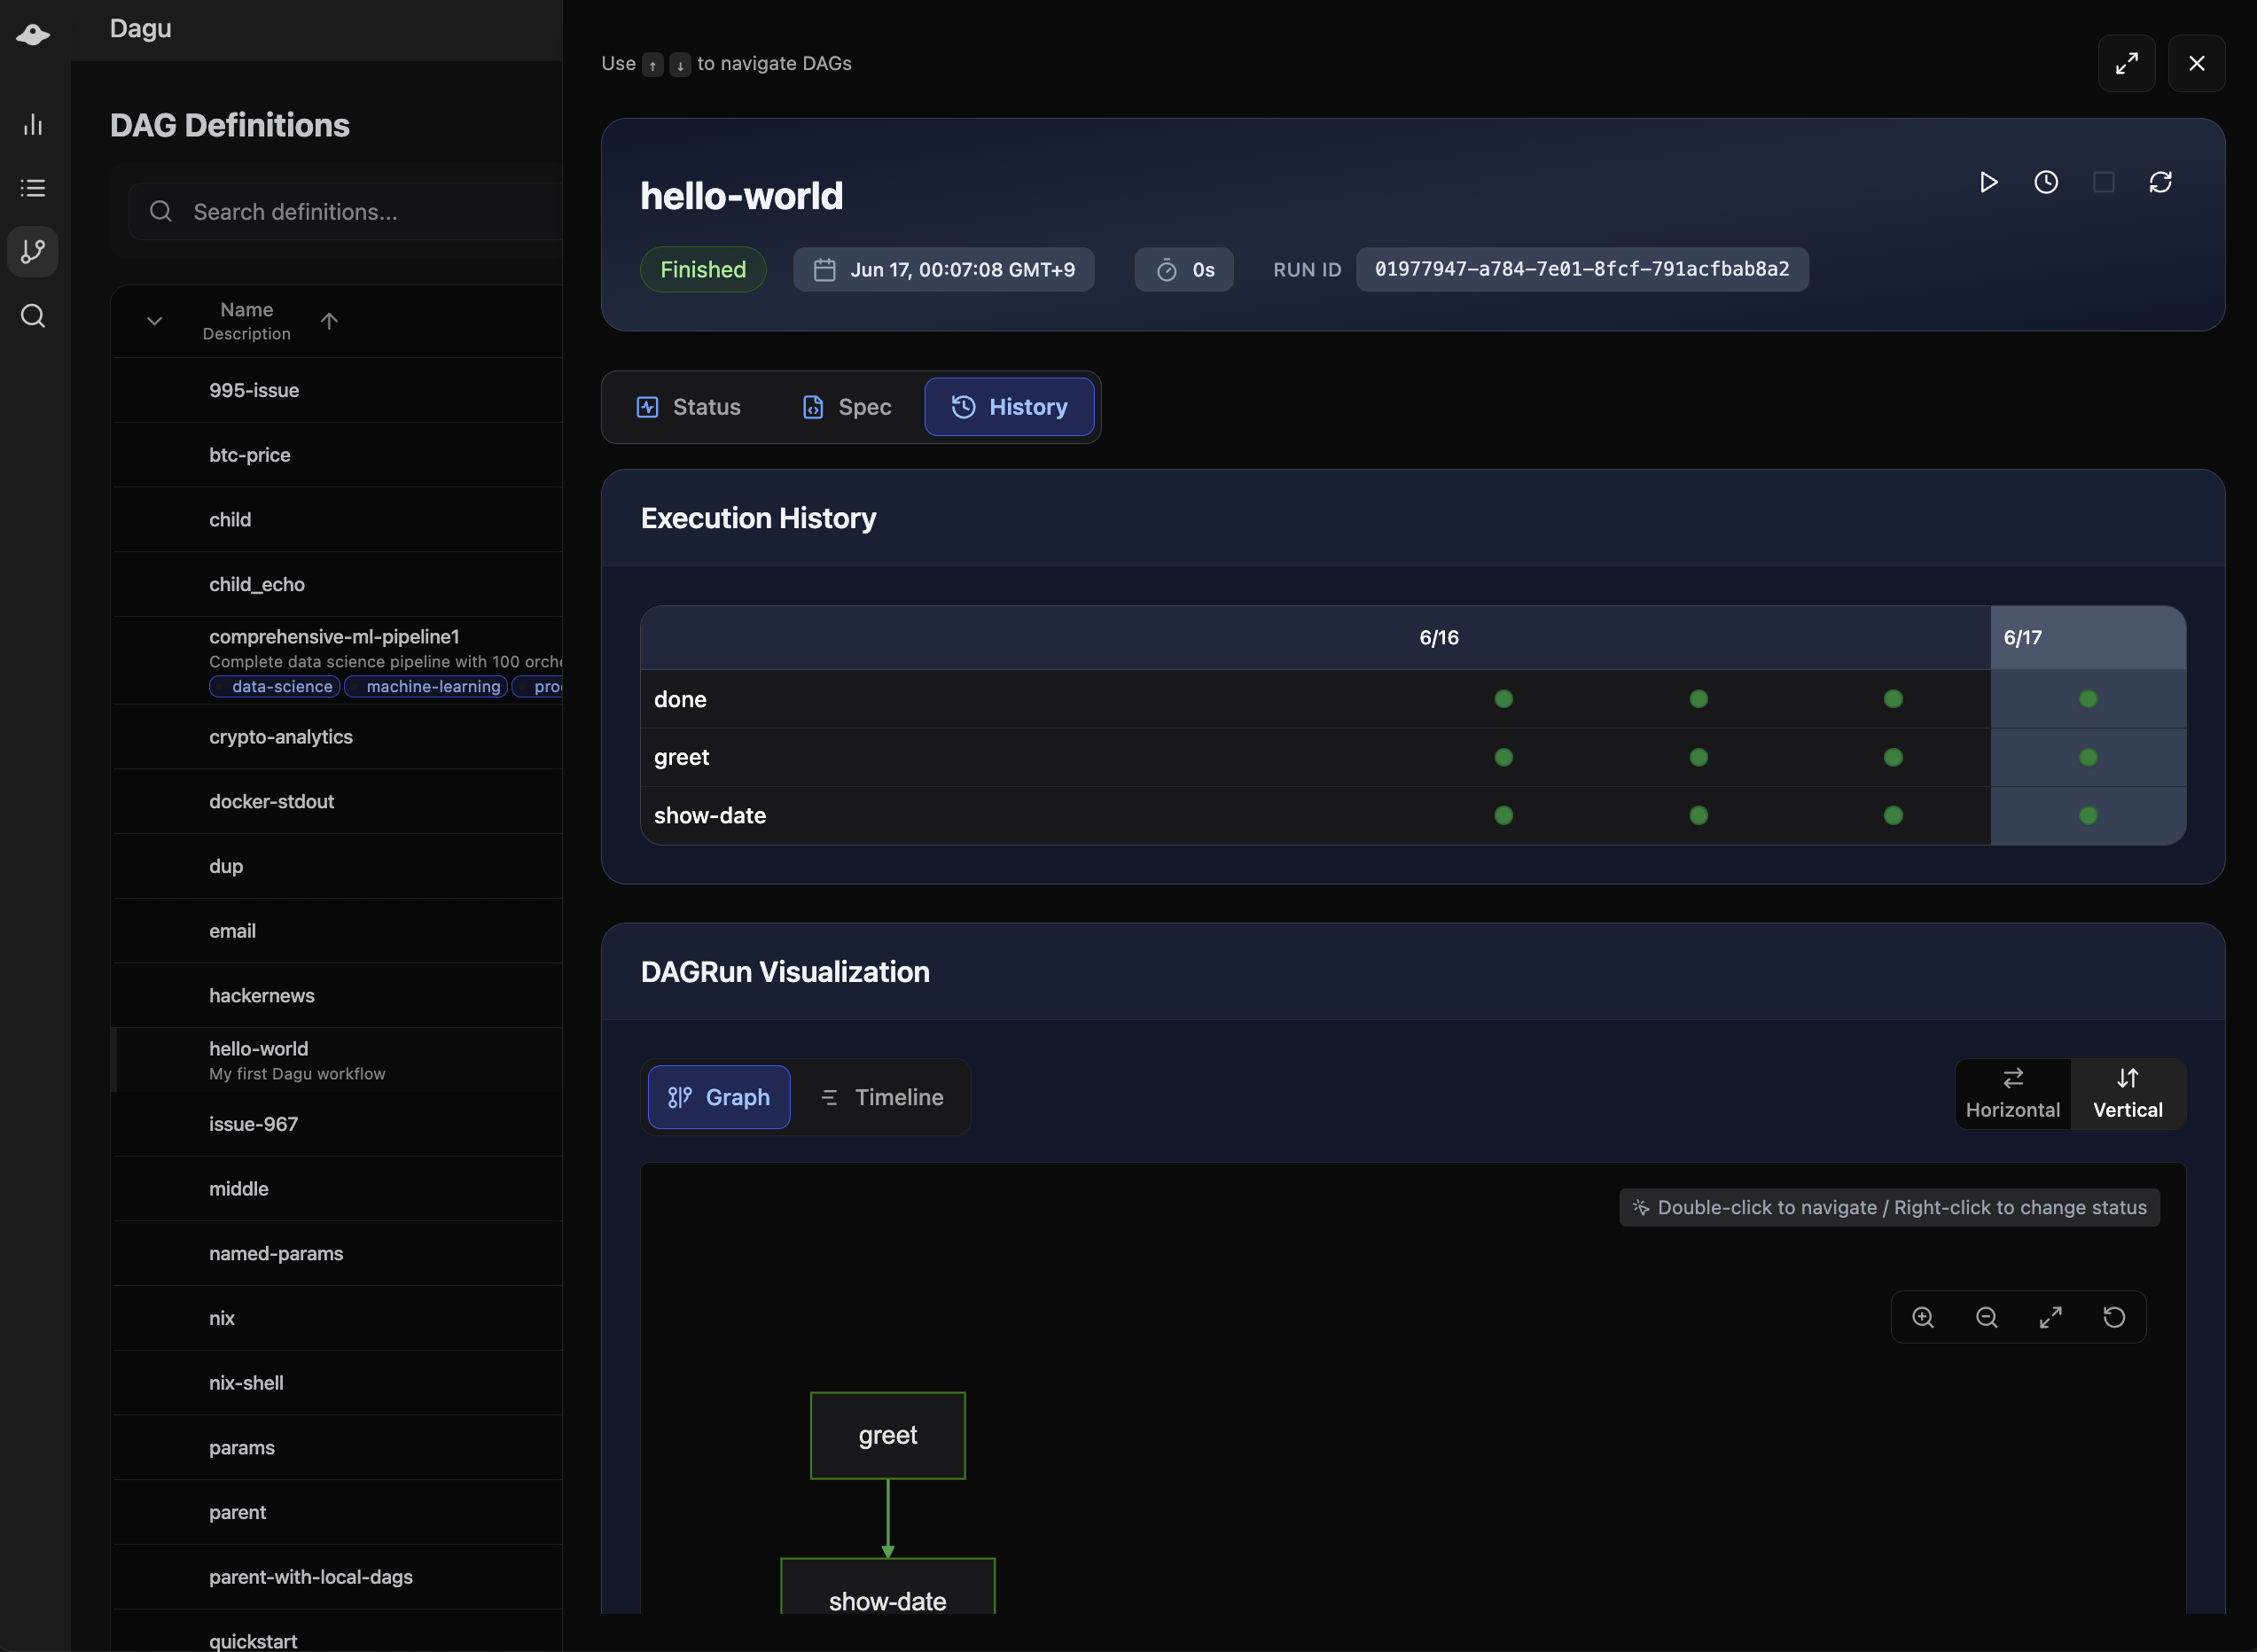
Execution History
The execution history page shows past execution results and logs, providing a comprehensive view of workflow performance over time.
Execution List
- Sortable by date, status, duration
- Pagination for large histories
- Quick actions (retry, view logs)
Execution Timeline
- Visual timeline of executions
- Identify patterns and issues
- Performance trends
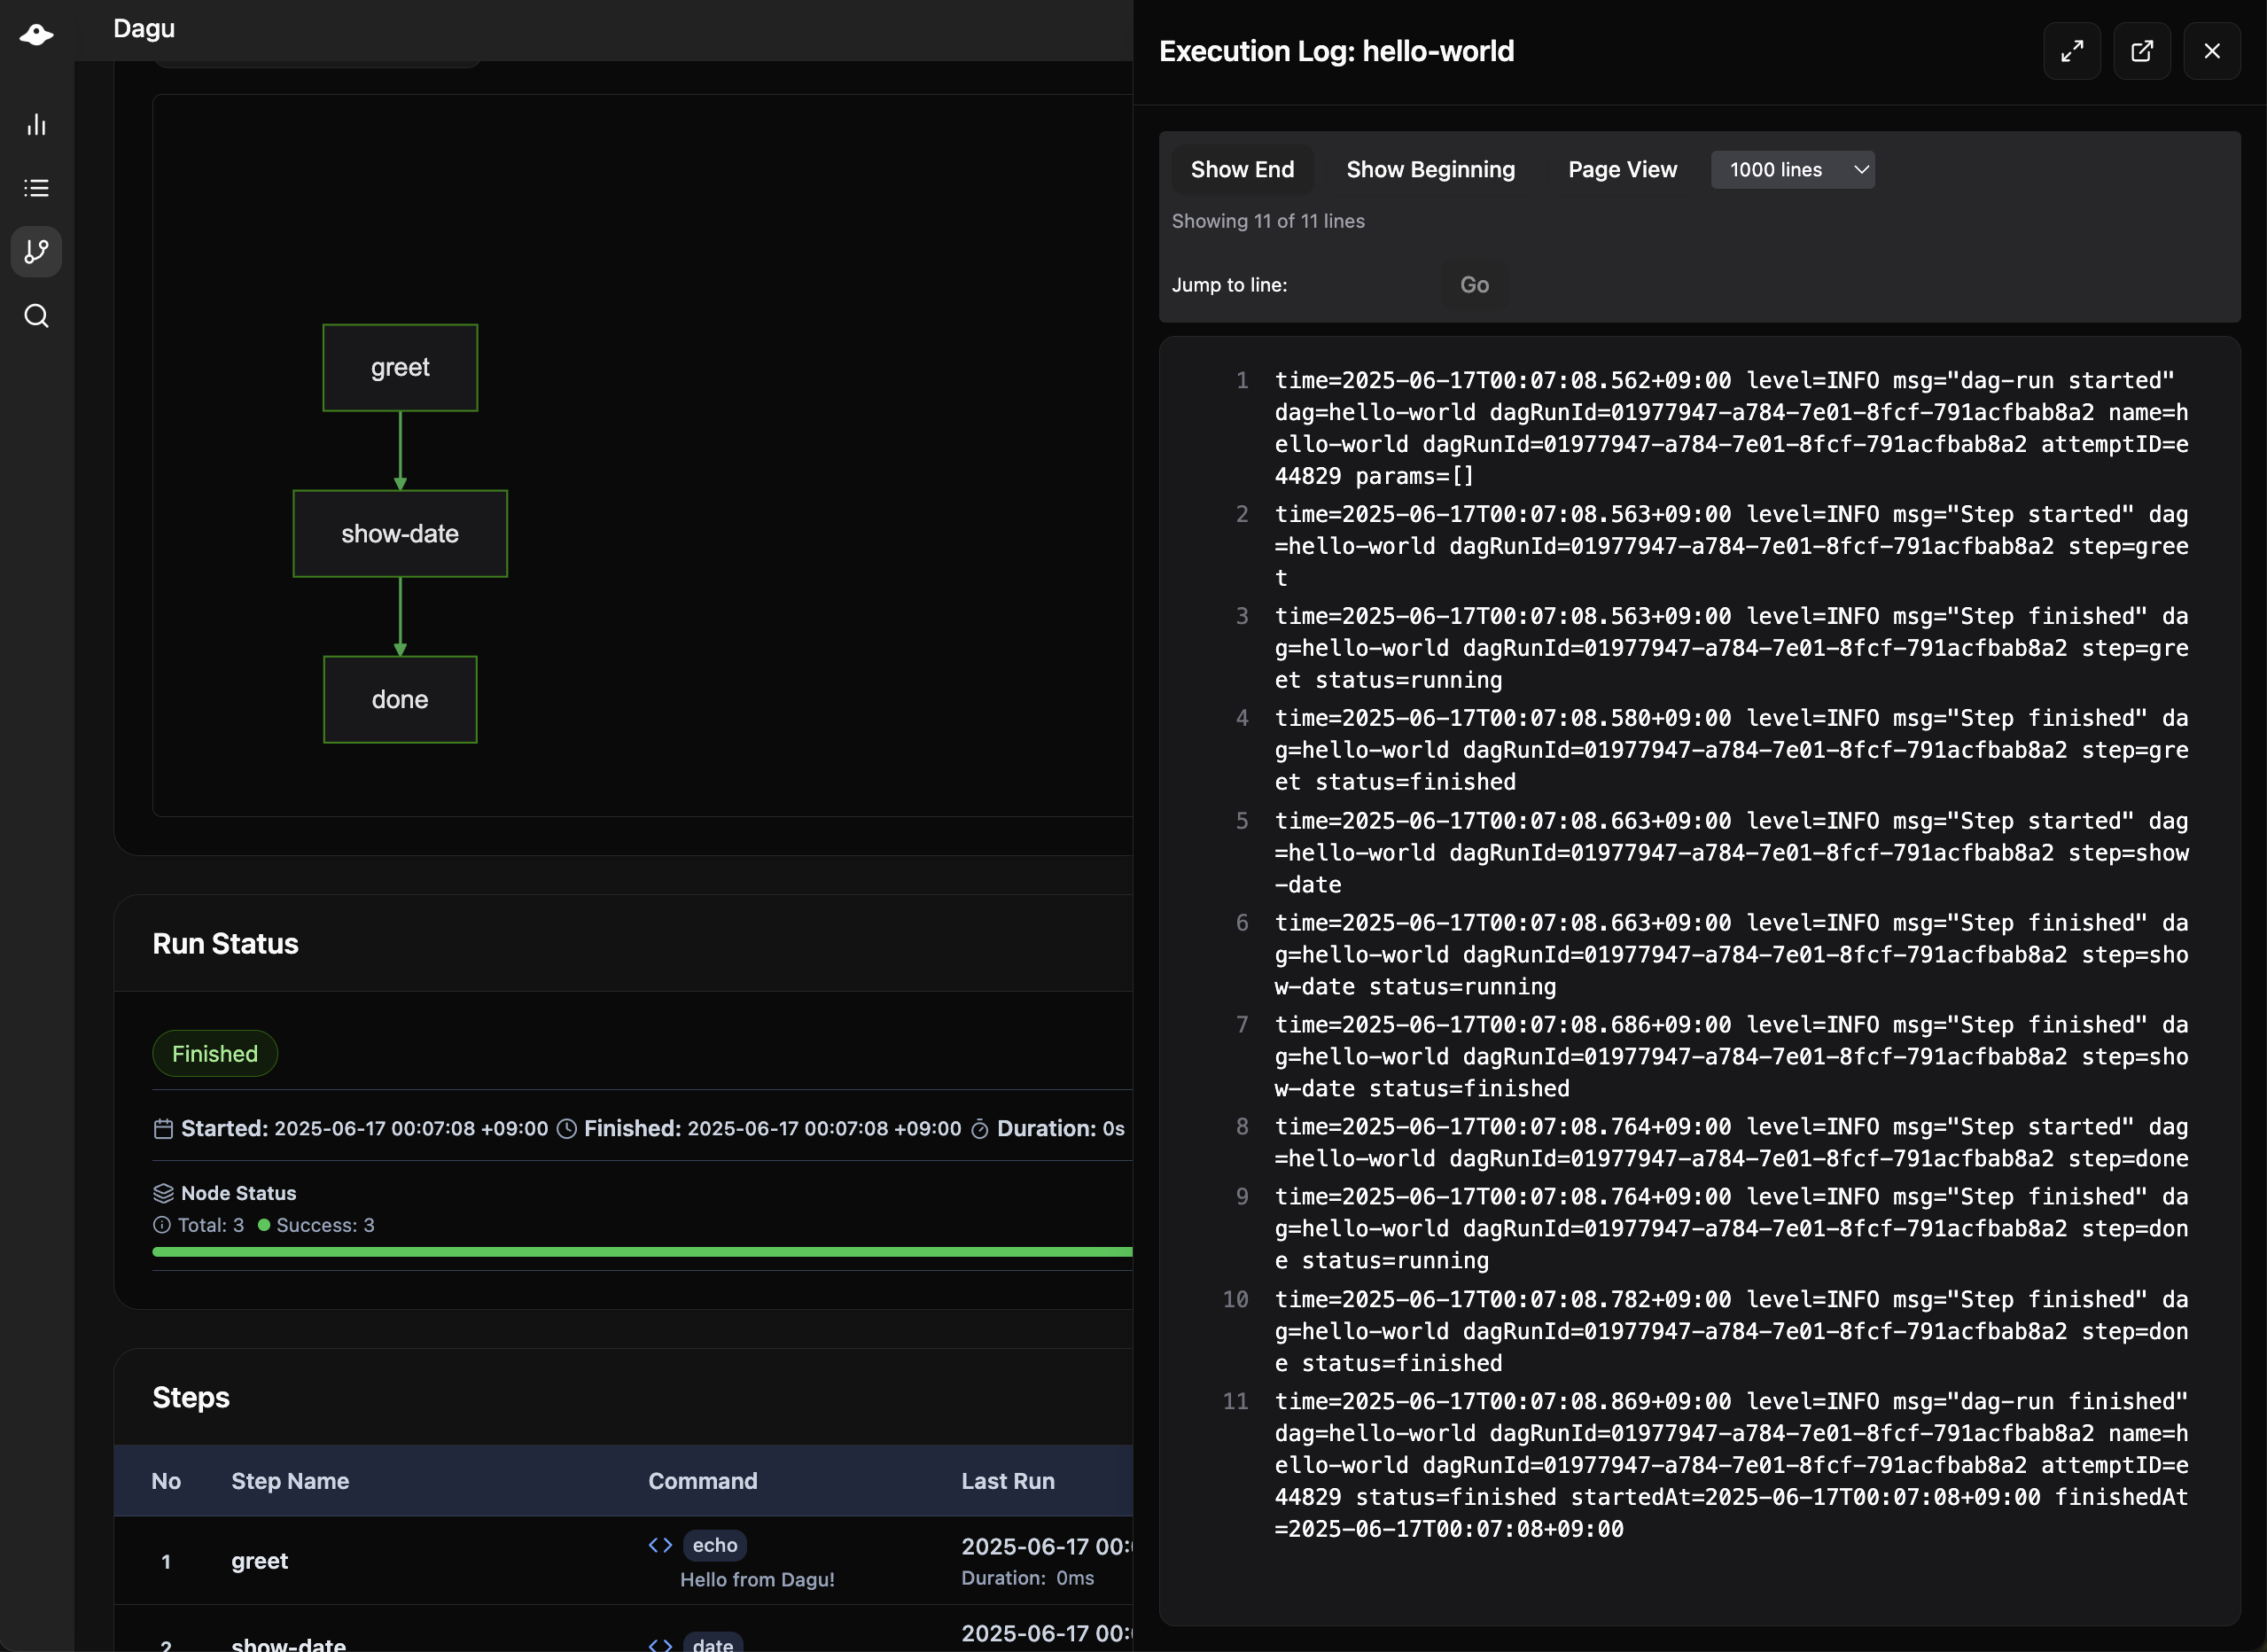
Execution Log
The execution log view shows detailed logs and standard output of each execution and step, helping you debug and monitor workflow behavior.
DAG Editor
Edit workflows directly in the browser:
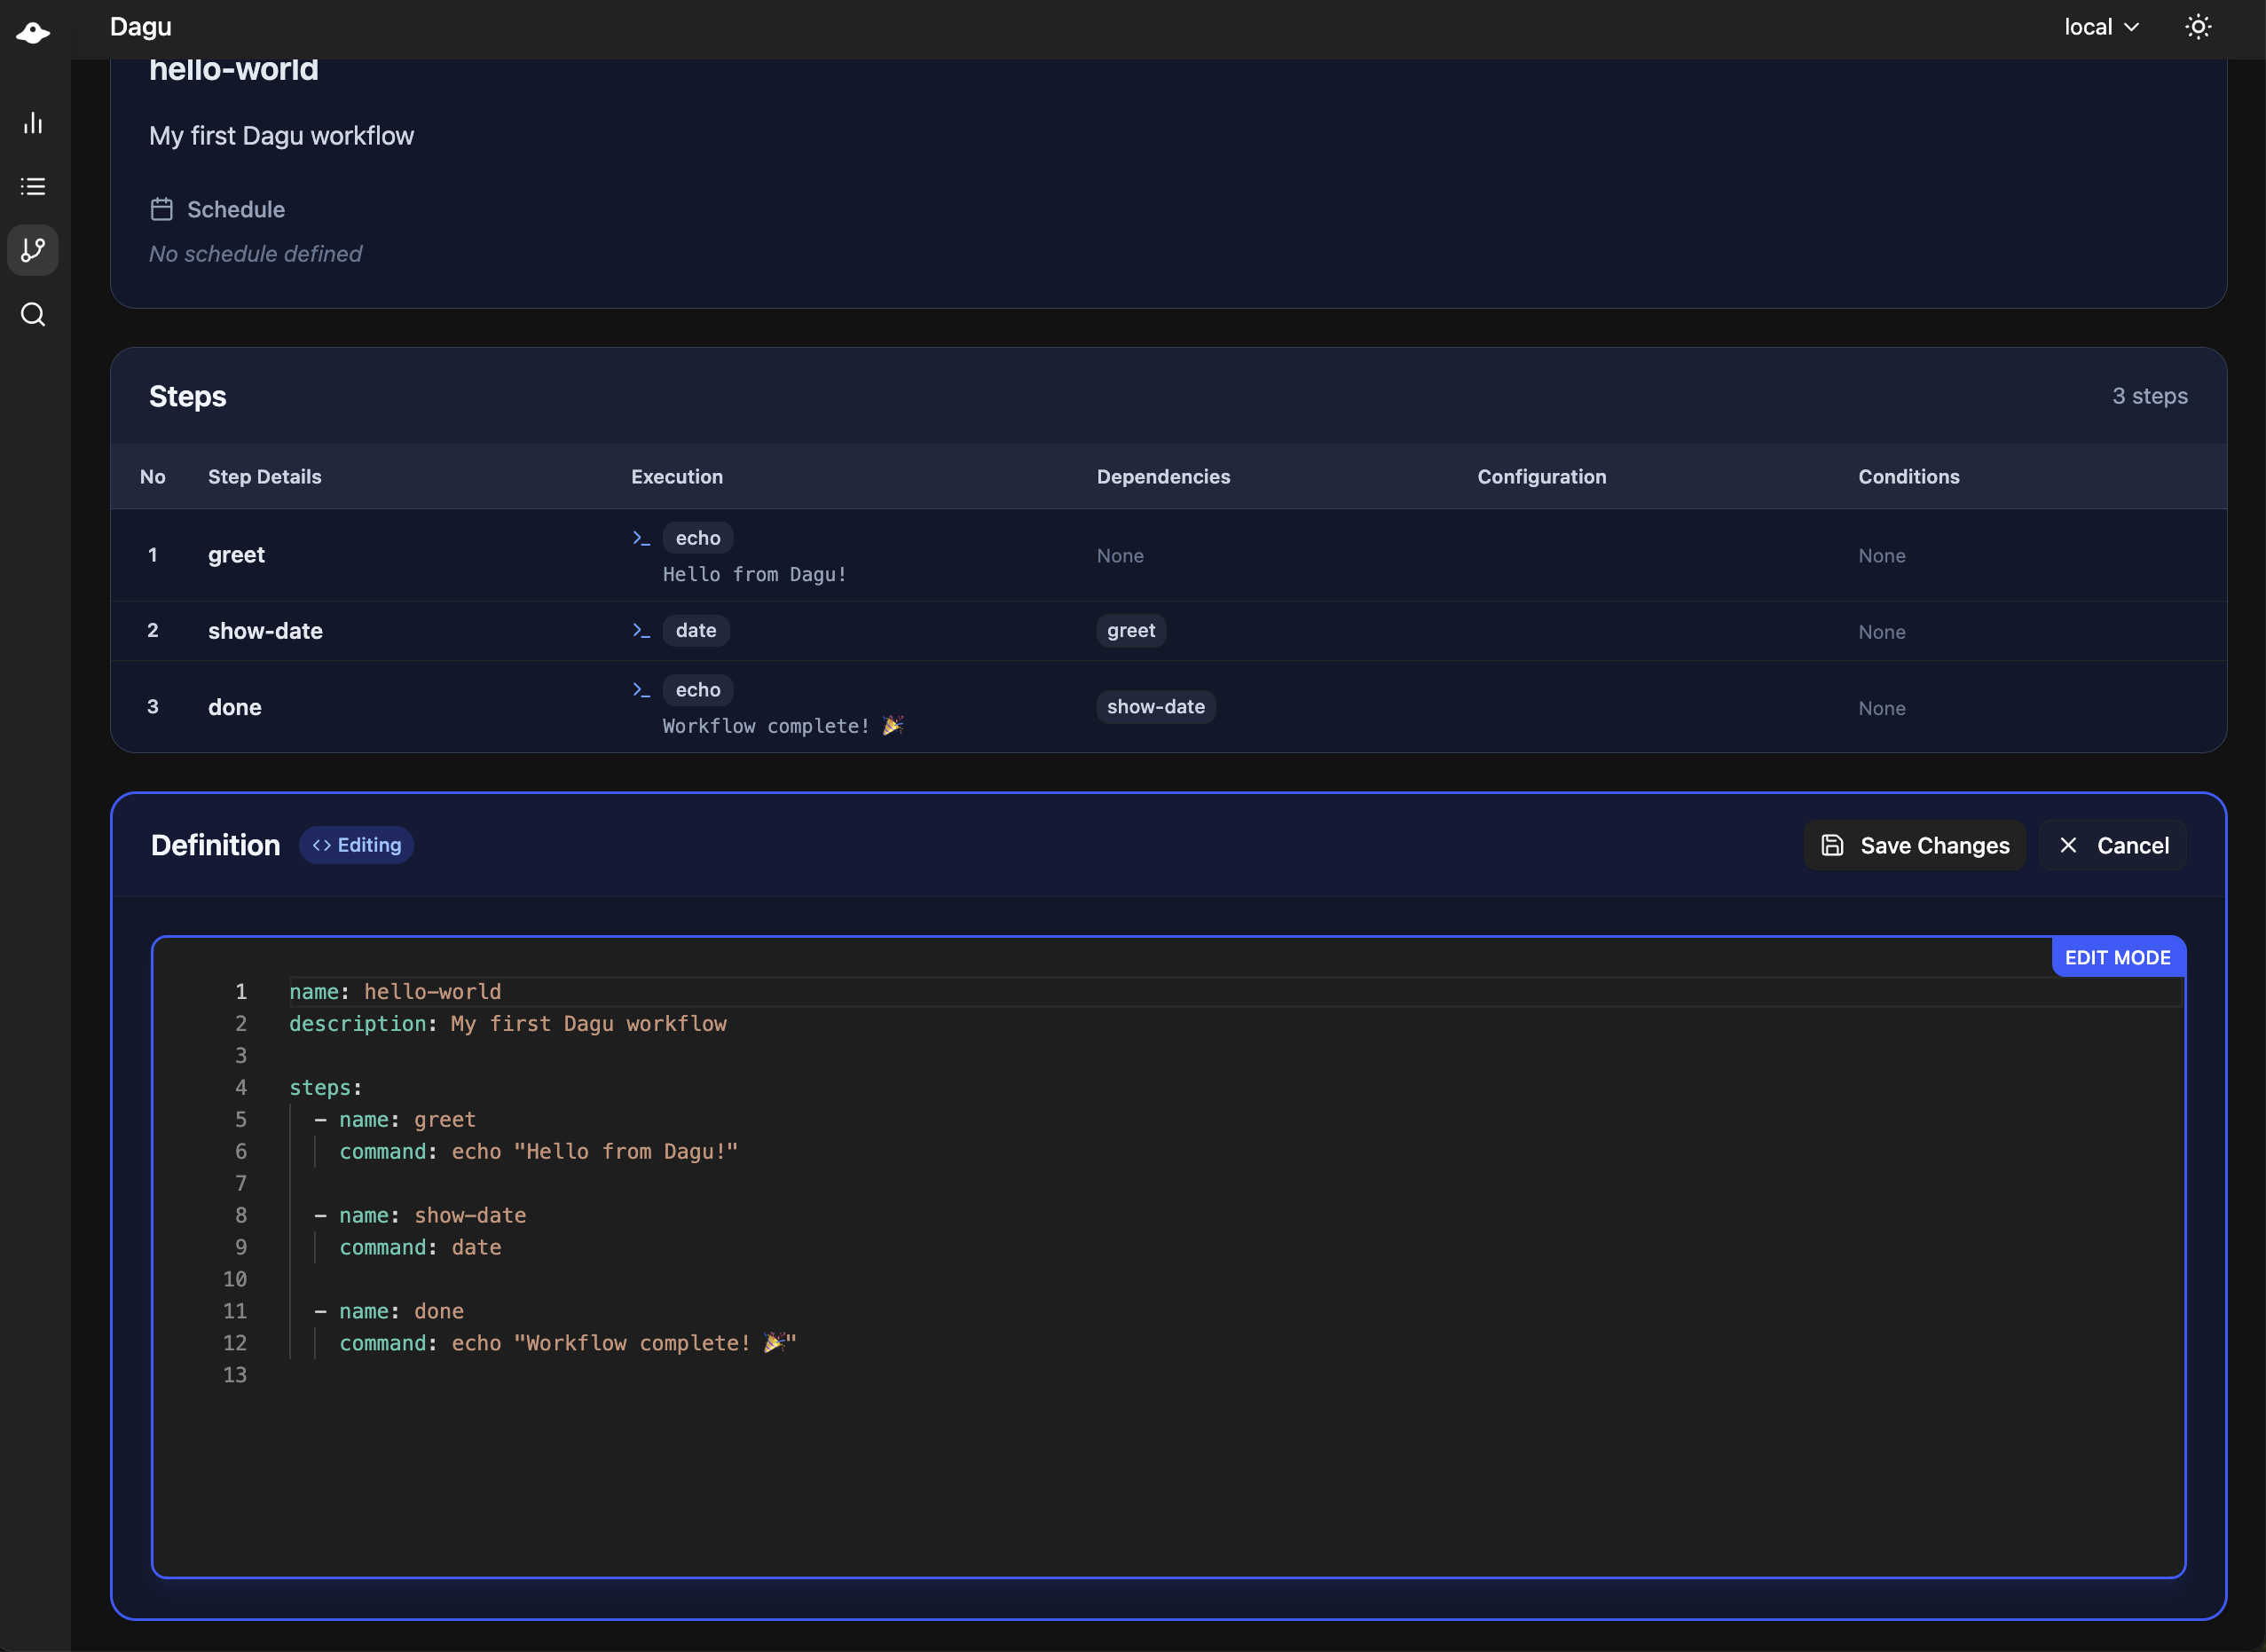
Features
- Syntax highlighting
- YAML validation
- Auto-completion
- Save with validation
Permissions
Requires writeDAGs permission:
permissions:
writeDAGs: trueSearch
The search functionality allows you to search for specific text across all DAGs in your system, making it easy to find workflows by content, variables, or any other text within the DAG definitions.
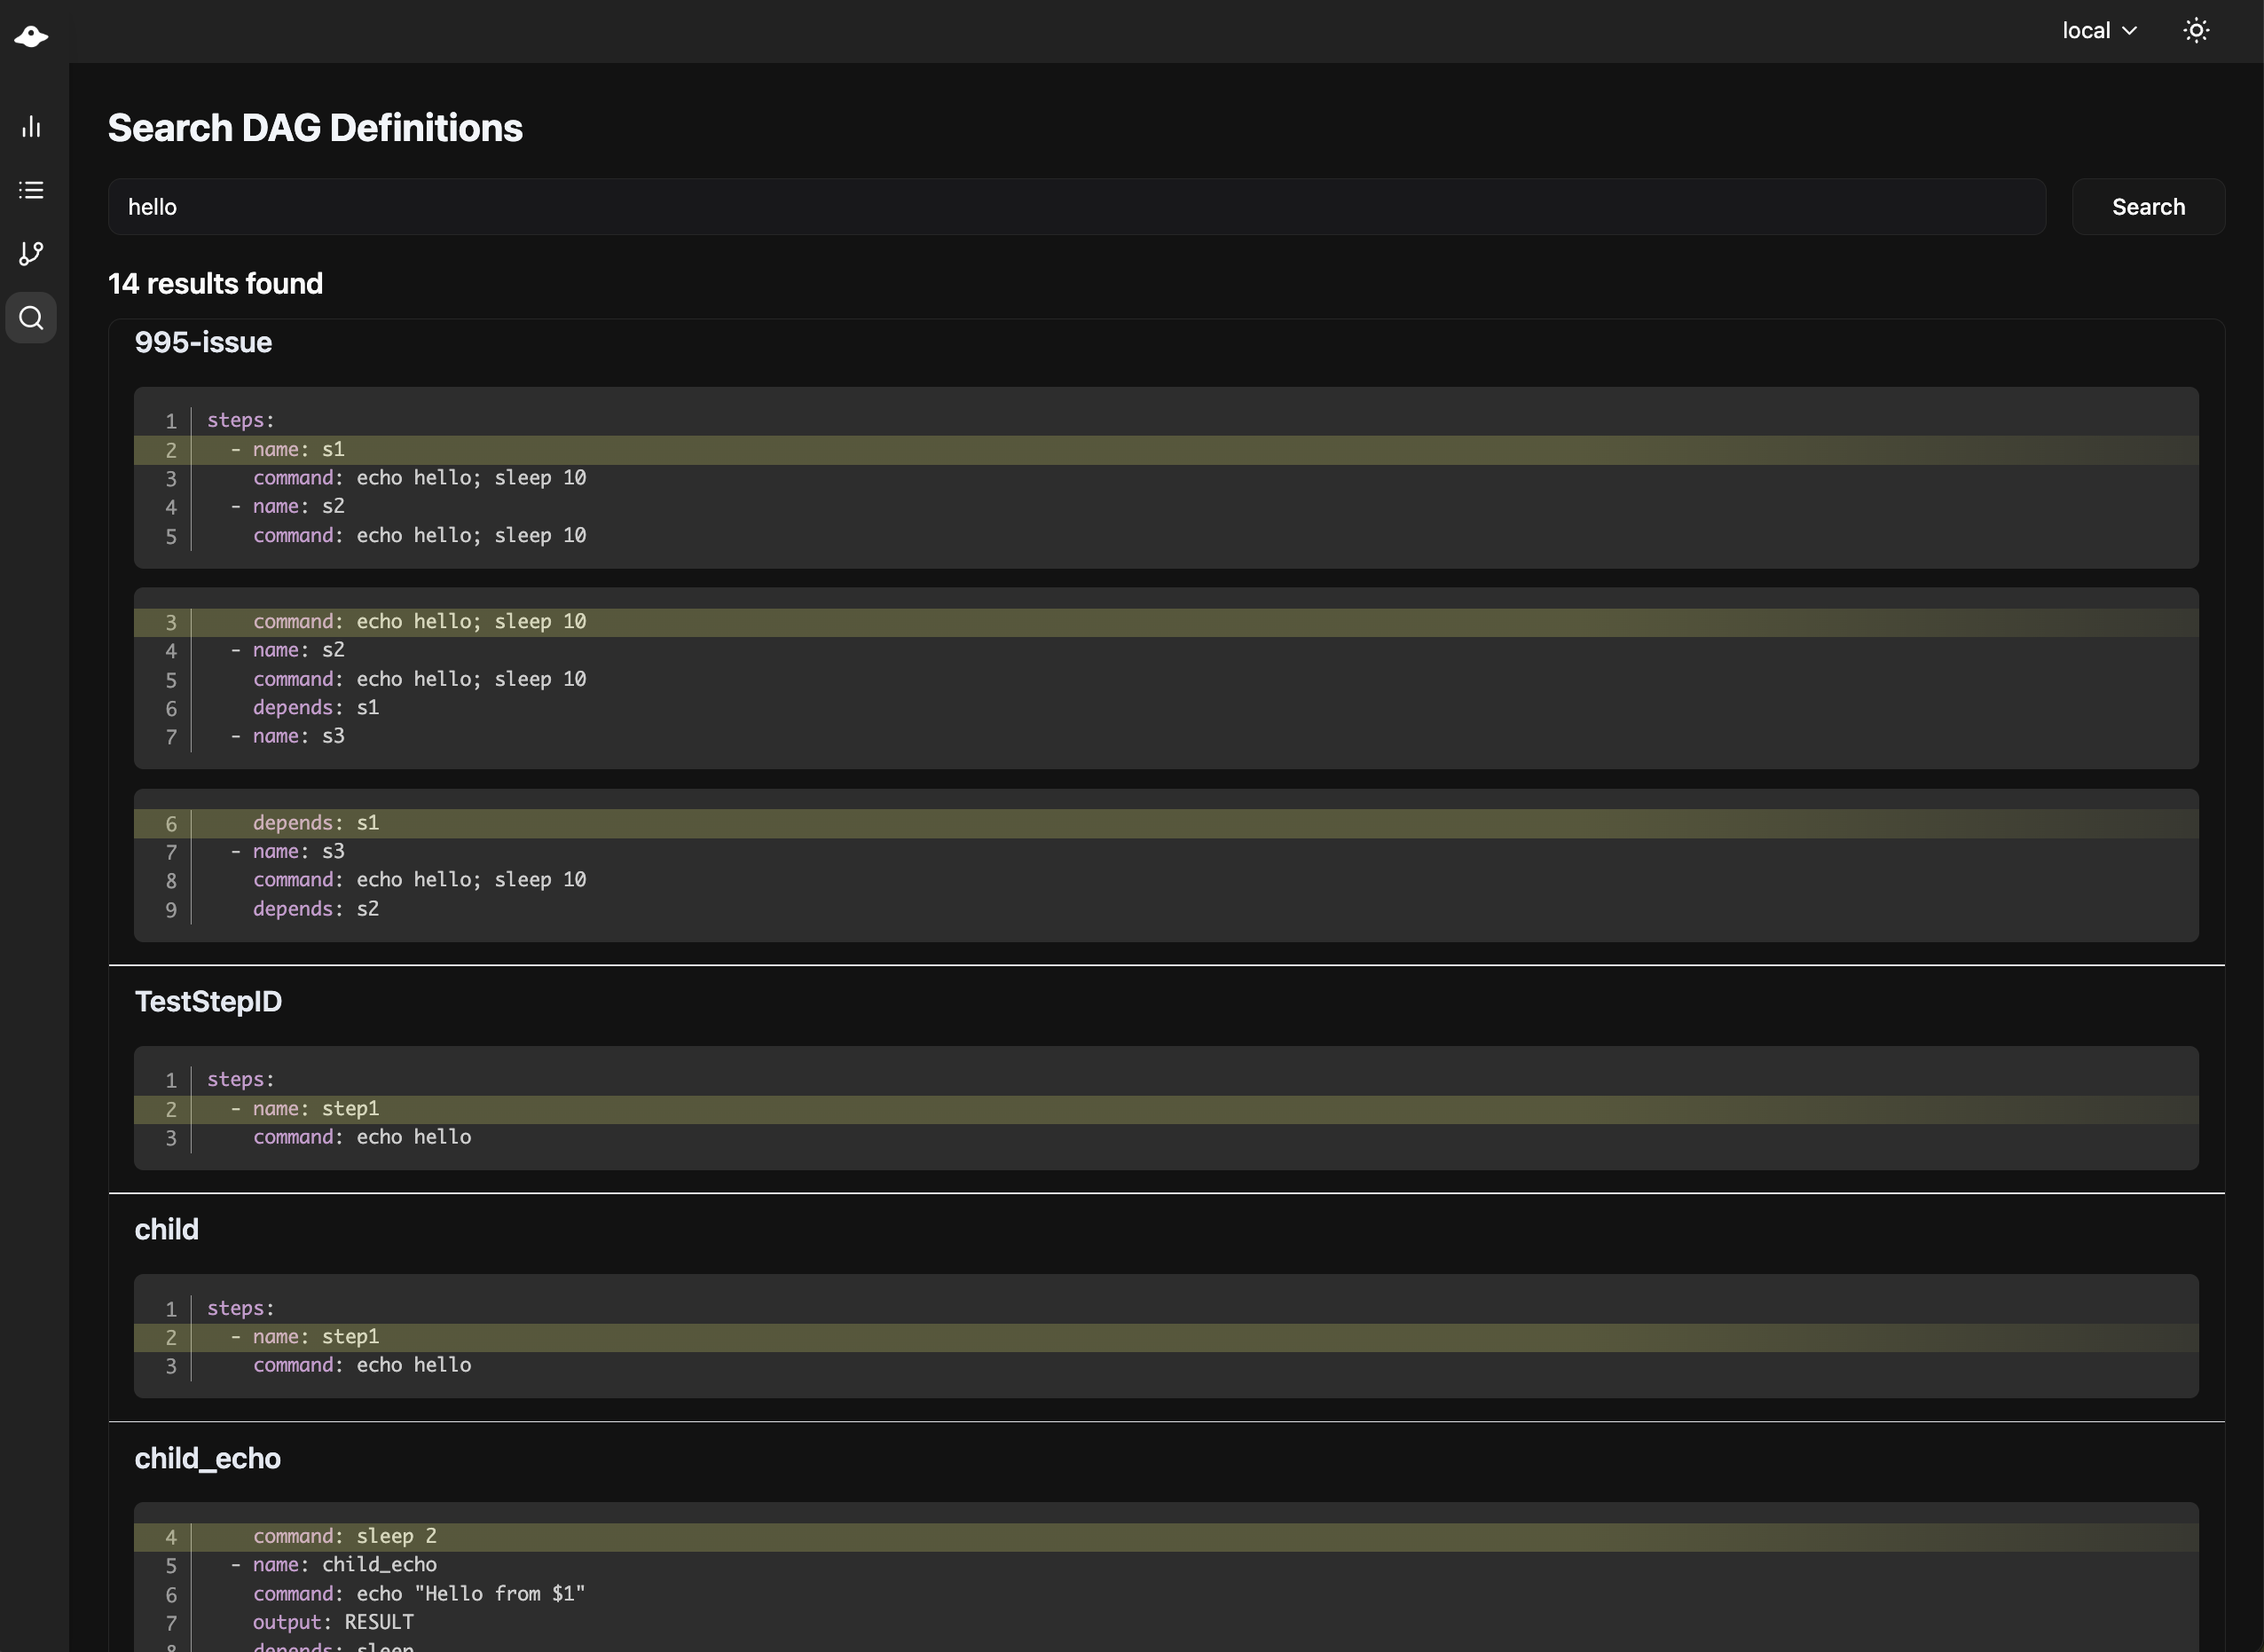
Global Search
- Search across all DAGs
- Find by name, tags, or content
System Status
The System Status page provides real-time monitoring of system health and resource usage.
Service Status
- Scheduler Service: Shows running scheduler instances with host, status, and uptime
- Coordinator Service: Shows coordinator instances for distributed execution
Resource Monitoring
Real-time charts display system resource usage:
- CPU Usage: Overall CPU utilization percentage
- Memory Usage: RAM utilization percentage
- Disk Usage: Storage utilization for the data directory
- Load Average: 1-minute system load average
Charts auto-refresh every 5 seconds and display historical data based on the configured retention period (default: 24 hours).
Configuration:
# config.yaml
monitoring:
  retention: "24h"    # How long to keep history
interval: "5s" # Collection frequencyWorkers
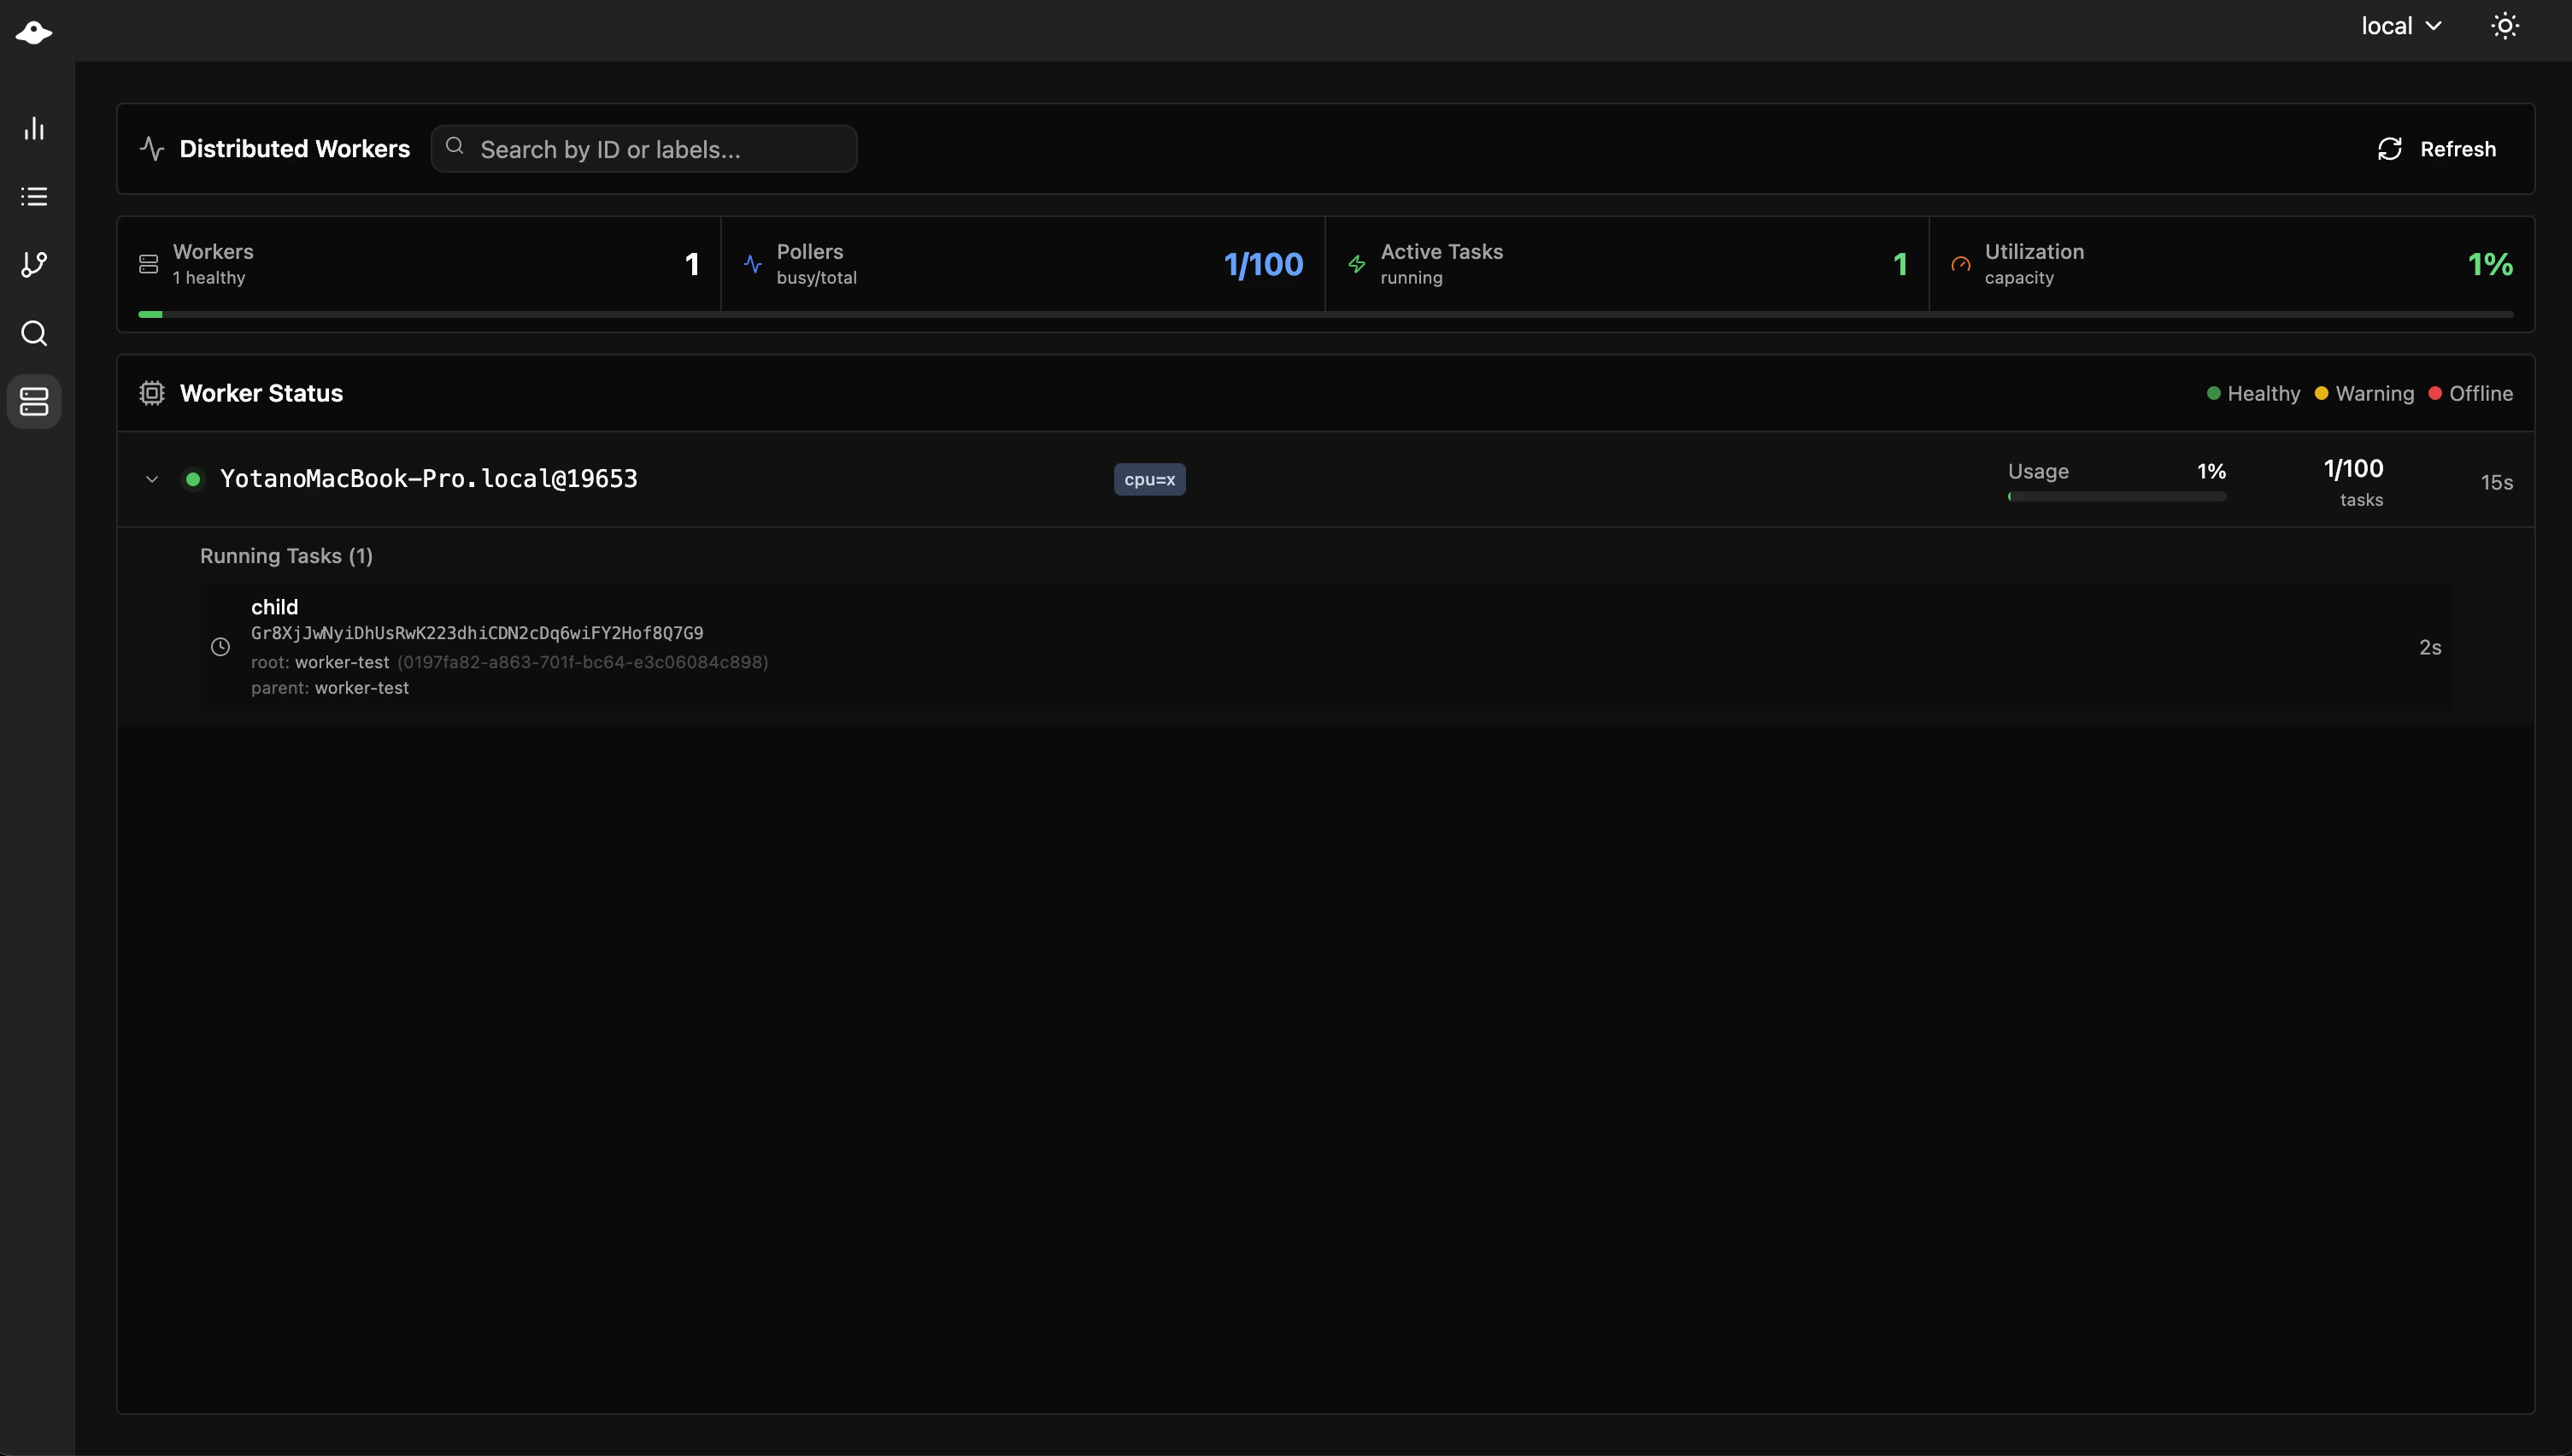
The Workers page provides real-time monitoring of distributed execution workers connected to the coordinator service.
Worker List
- Worker ID: Unique identifier for each worker
- Labels: Capability labels (GPU, memory, region, etc.)
- Health Status: Visual health indicators
- Green: Healthy (< 5s since last heartbeat)
- Yellow: Warning (5-15s since last heartbeat)
- Red: Unhealthy (> 15s since last heartbeat)
- Last Heartbeat: Time since last communication
- Running Tasks: Currently executing DAG runs
Running Task Details
For each running task, you can see:
- DAG Name: The workflow being executed
- DAG Run ID: Unique execution identifier
- Root DAG: Top-level workflow (for nested DAGs)
- Parent DAG: Immediate parent (for sub DAGs)
- Started At: Task start time
Navigating to Task Details
Click on any running task to open the DAG run details modal:
- For root tasks: Opens DAG run details directly
- For child tasks: Opens parent DAG with child view and breadcrumb navigation
- Ctrl/Cmd+Click: Opens task details in a new tab
Worker Labels Display
Each worker shows its capability labels as badges:
Worker: gpu-worker-01
Labels: [gpu=true] [cuda=11.8] [memory=64G] [region=us-east-1]UI Customization
Branding
# config.yaml
ui:
  navbarColor: "#00D9FF"
navbarTitle: "My Workflows"Display Options
ui:
  maxDashboardPageLimit: 100  # Items per page
  logEncodingCharset: utf-8   # Log encoding
  dags:
    sortField: "name"         # Default sort field
sortOrder: "asc" # Default sort orderRemote Nodes
Monitor multiple Dagu instances:
remoteNodes:
  - name: staging
    apiBaseURL: https://staging.example.com/api/v2

  - name: production
    apiBaseURL: https://prod.example.com/api/v2
authToken: ${PROD_TOKEN}Features
- Unified dashboard
- Centralized management
Security Considerations
HTTPS Setup
tls:
  certFile: /path/to/cert.pem
keyFile: /path/to/key.pemCORS Configuration
Configure for API access from different domains:
cors:
  enabled: true
  allowedOrigins:
- https://app.example.comSee Also
- Learn the REST API for automation
- Configure authentication for security
- Set up monitoring for production